Waterfall charts allow you to display a running total for a given data point as values increase and decrease over time. When working with waterfall charts, you can change the report background color. You can also adjust the chart padding, how the final value will be shown, and the waterfall colors.
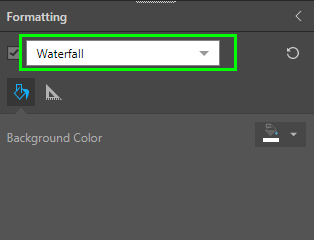
Fill
- Background Color: Change the color of the Report Background using the Color Picker tool. This change does not affect the chart background.
Settings
From the Settings tab, you can adjust the chart padding and the data and value display.
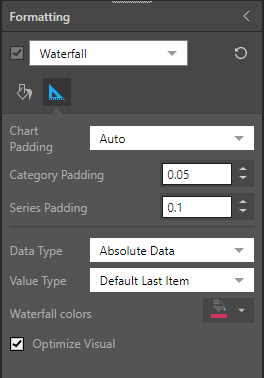
- Chart Padding: choose either Auto or Fixed.
- Auto: apply auto padding, and make changes as needed.
- Category Padding: affects the padding between the categories on the x-axis.
- Series Padding: affects the padding between all segments in the series of member elements.
- Fixed: set the column width according to a given fixed number of pixels. Set to 30 pixels by default.
- Auto: apply auto padding, and make changes as needed.
- Data Type: set the way the data should be displayed.
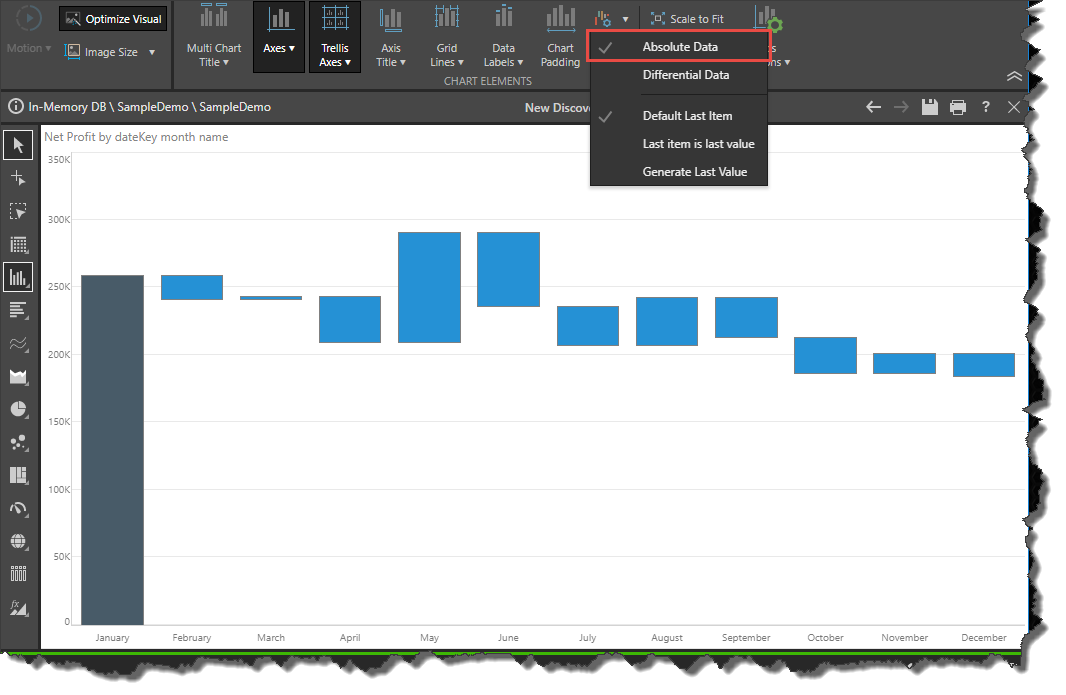
- Absolute Data: the default data type is absolute data, meaning the chart is adjusted to suit absolute values. If the data set in the query has absolute values, choose Absolute Data.
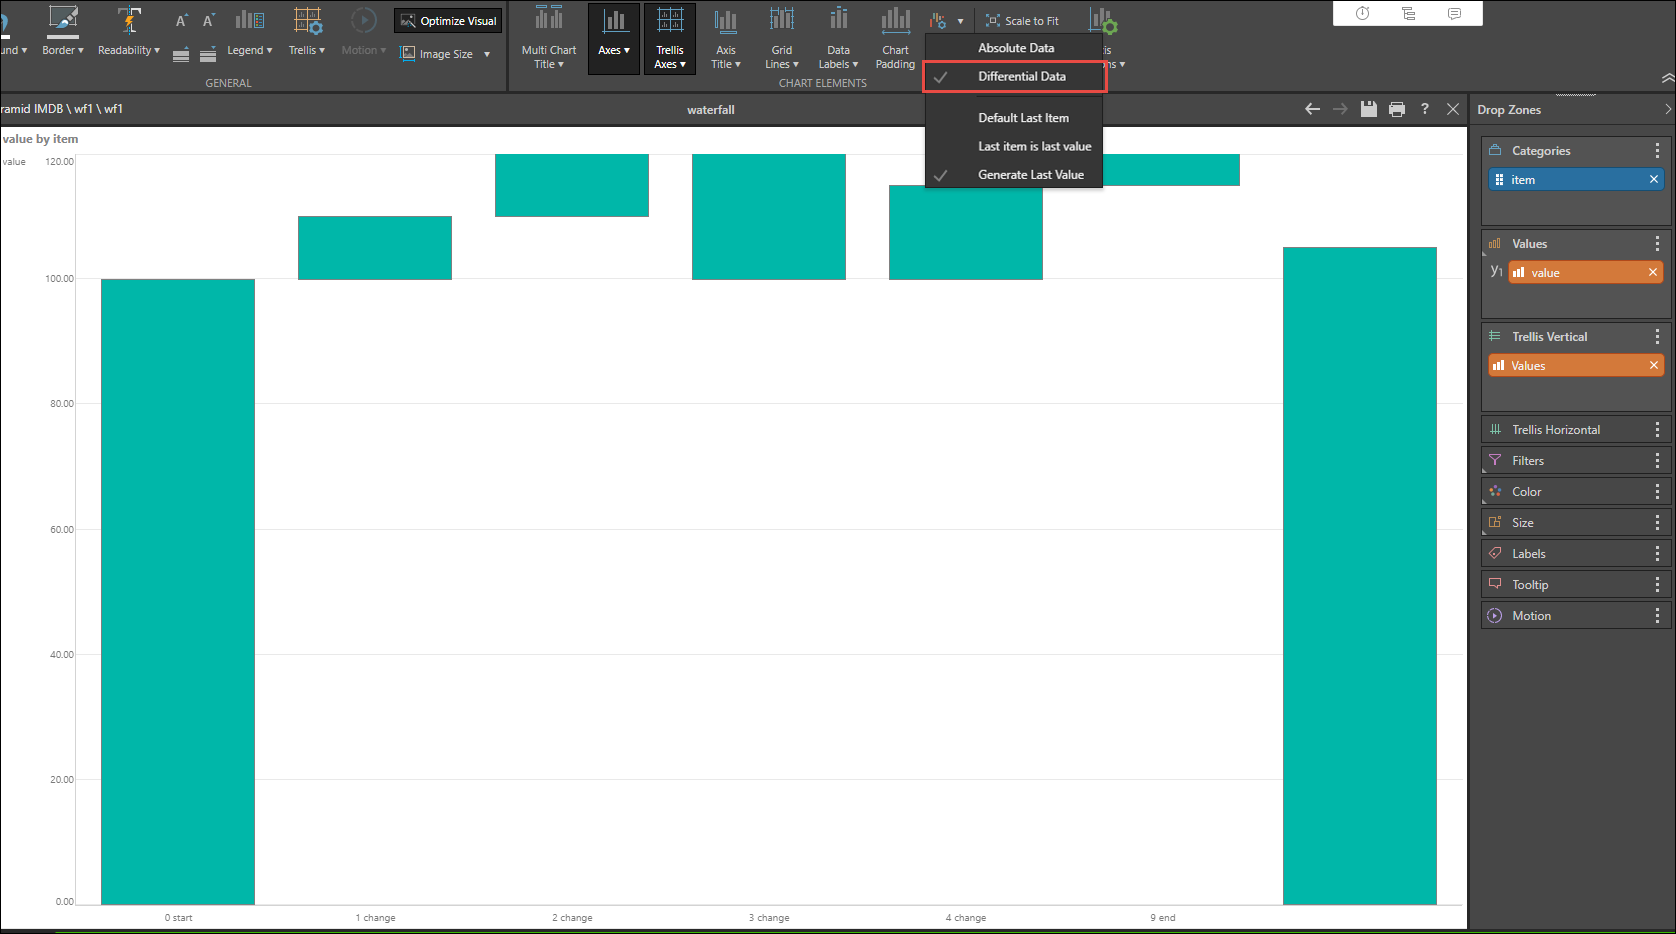
- Differential Data: if your database has differential values that you want to add to the chart, select Differential Data. This will ensure that the chart is optimized to display the difference, rather than absolute values.
- Value Type: determine how the last value will be shown.
- Default Last Item: this is the default option, and the last item will be calculated and displayed in the same manner as the previous items.
- Last Item is Last Value: the last column will start at 0 and end at the value of the last item. It is not logical to use this option when looking at differential data, but it can be a good way to view absolute data.
- Generate Last Value: generates an additional column that starts at 0 and ends at the value of the last item.
- Waterfall Colors: change the color of the first bar. If the value type is set to "Last item is last value" "Generate Last Value," the selected color will also be applied to the last bar.
- Optimize Visual: the visual optimization engine in Pyramid is a heuristic that automatically redacts certain parts of a graphical visualization based on the amount of space provided.
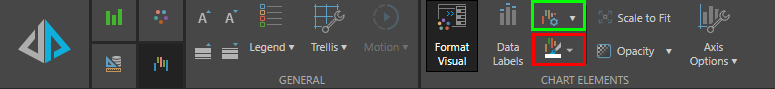
Component Ribbon
Data Type, Value Type, and Waterfall Colors can also be changed from the Component ribbon. Open the Waterfall Type dropdown list (green highlight below) to change the data type or value type. Open the Waterfall Colors dropdown list (red highlight below) to change the waterfall colors.
Here, the query contains absolute data, so the data type was set to Absolute Data.
Here, the hierarchy in the Categories drop zone contains differential data, so the data type was set to differential data:
Here the Value type was set to Default Last Item:
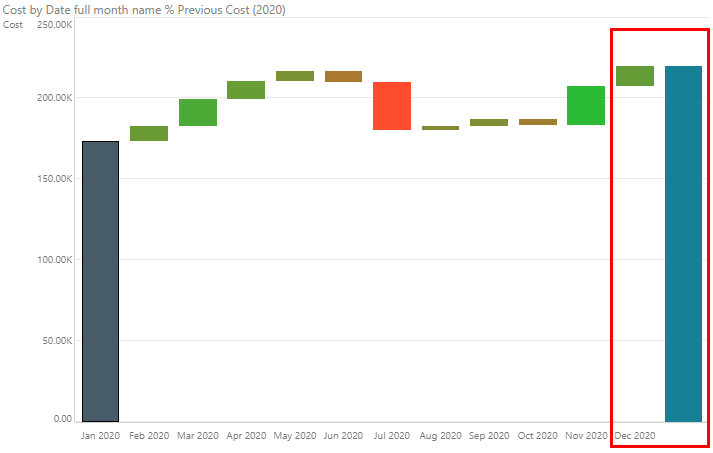
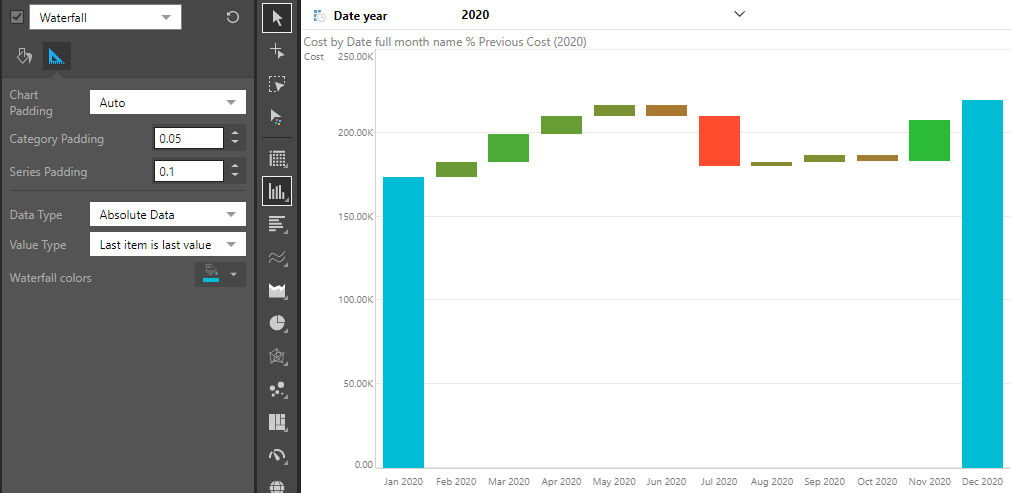
In this example, the value type was set to "Last item is last value" and waterfall colors changed to blue:
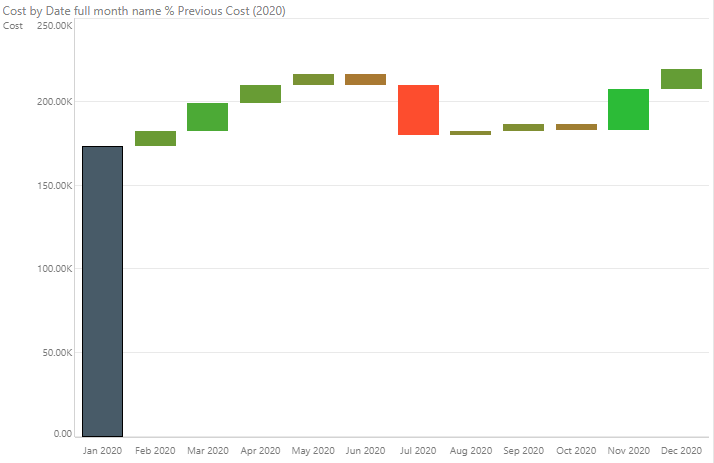
Here, the value type was set to Generate Last Value. We see the last value on Dec 2020, followed by a generated value: